Decarbonizing Packaging Supply Chains
Transportation accounts for up to 40% of packaging's total carbon footprint. Learn how to reduce Scope 3 emissions through smarter packaging design and logistics optimization.
By Kevin Kai Wong, Managing Partner at gCurv Technologies
March 5, 2026
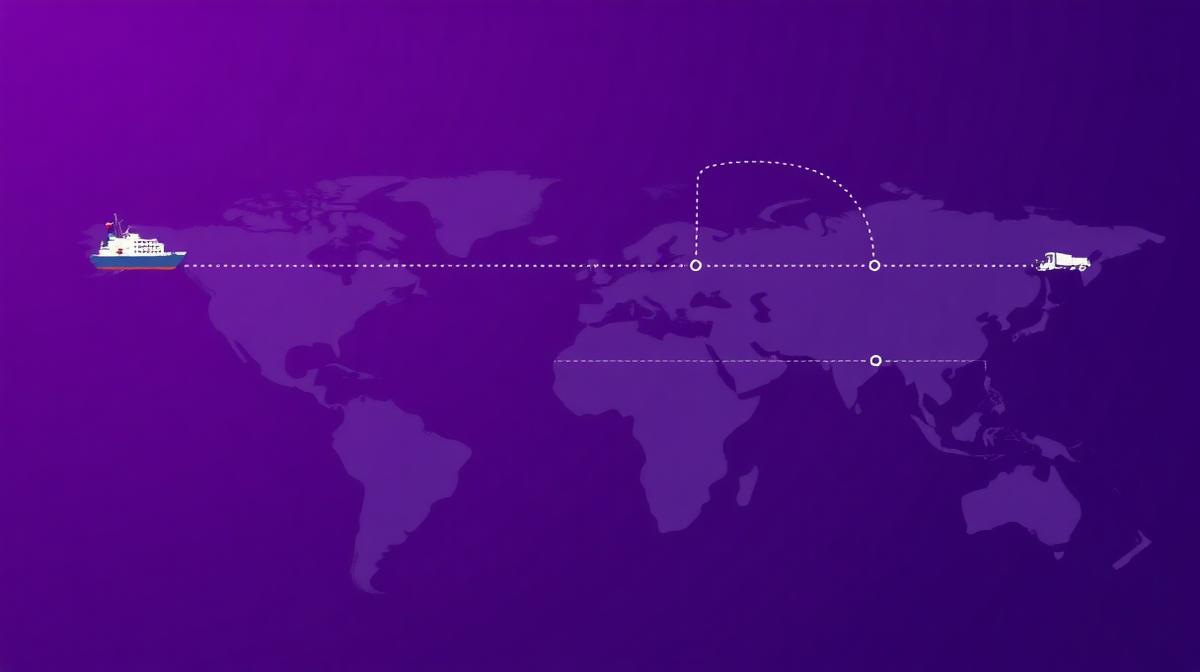
Table of Contents
The packaging industry's carbon footprint extends far beyond the factory floor. Transportation, from raw material sourcing through final delivery, can account for 30-40% of a packaging product's total lifecycle emissions. As companies face increasing pressure to report and reduce Scope 3 emissions, understanding and optimizing supply chain carbon has become a strategic imperative.
The Hidden Carbon in Your Supply Chain
Most companies underestimate the carbon intensity of their packaging supply chain. A typical corrugated box might travel 3,000+ miles from forest to consumer: timber sourced from managed forests is transported to pulp mills, then to paper mills, then to converting facilities, then to brand distribution centers, and finally to retail or direct-to-consumer destinations.
Each leg of this journey generates emissions. A single truckload of packaging materials produces approximately 0.2 kg CO2e per ton-mile. Ocean freight is more efficient (0.015 kg CO2e per ton-mile) but adds weeks to supply chains. Air freight is catastrophic (1.2 kg CO2e per ton-mile) and should be avoided for packaging materials entirely.
Key Metrics to Track
Portfolio Items Assessed: Begin by cataloging every packaging SKU and mapping its complete supply chain journey. Most companies are surprised to find 20-30% of their packaging travels unnecessary distances due to historical supplier relationships rather than geographic logic.
Transportation Emissions by Mode: Break down your packaging logistics by transportation mode. The goal is to maximize ocean and rail (lowest emissions per ton-mile), optimize truck routes and fill rates, and eliminate air freight for packaging materials entirely.
Supplier Proximity Score: Calculate the weighted average distance your packaging materials travel. Localized sourcing can reduce transportation emissions by 40-60% while also improving supply chain resilience.
The Impact of Packaging Weight and Density
Lightweight packaging doesn't just reduce material costs, it dramatically reduces transportation emissions. Every gram removed from packaging reduces the fuel required to move it through the supply chain.
Consider a beverage company shipping 10 million bottles annually. Reducing bottle weight by 10 grams saves 100 tonnes of plastic per year, but it also eliminates the transportation emissions for moving those 100 tonnes through the supply chain, approximately 8-12 tonnes of CO2e annually from transportation alone.
Cube Utilization and Pallet Efficiency
Beyond weight, packaging density affects transportation emissions. Poorly designed packaging creates air pockets that require more trucks to move the same quantity of products. Optimizing cube utilization, the percentage of truck or container volume actually occupied by product, can reduce transportation emissions by 15-25%.
Key strategies include right-sizing packaging to minimize void space, redesigning secondary packaging for better pallet stacking, using collapsible or nestable packaging where appropriate, and implementing automated packaging systems that match package size to product dimensions.
Regional Sourcing Strategies
The most effective way to reduce supply chain carbon is to source packaging closer to where it's used. This requires rethinking traditional procurement approaches that prioritize lowest unit cost over total supply chain impact.
Building a Regional Supply Network
Companies achieving the best supply chain carbon reductions typically source primary packaging within 500 miles of filling/packing locations, source secondary packaging within 200 miles of distribution centers, and establish regional supplier relationships that can flex with demand.
The financial case for regional sourcing is often stronger than expected. While unit costs may be 3-8% higher from regional suppliers, total landed cost, including freight, inventory carrying costs, and carbon pricing, frequently favors local sources. Add in supply chain resilience benefits and the case becomes compelling.
Mode Shifting and Route Optimization
Where sourcing can't be localized, mode shifting offers the next best opportunity for emissions reduction. Key strategies include converting truck shipments to intermodal (rail + truck) for distances over 500 miles, using ocean freight instead of air for international shipments, consolidating shipments to improve truck fill rates, and implementing milk-run delivery patterns for multi-stop routes.
Modern route optimization software can reduce transportation emissions by 10-20% through better load planning and route selection, often with simultaneous cost savings.
How Packgine Helps
Packgine makes supply chain carbon visible and actionable across your entire packaging portfolio.
EPR & PPWR Compliance Automation: As regulations increasingly require Scope 3 reporting (including transportation emissions), Packgine automatically calculates and tracks supply chain carbon for every packaging SKU, ensuring compliance with emerging disclosure requirements.
Compliance Cost Estimating: Model the carbon and cost impact of supply chain changes before implementing them. Packgine's scenario planning tool lets you compare regional sourcing alternatives, mode shifting opportunities, and lightweighting investments, all with projected emissions reductions and financial impact.
Alternative Product Suggestions: Packgine identifies packaging alternatives that reduce both material and transportation emissions. Our recommendation engine factors in supplier location, packaging weight, and cube utilization to suggest changes that optimize your entire supply chain carbon footprint.
Detailed Emission Hotspot Analysis
Understanding where emissions concentrate in your packaging supply chain is the first step toward meaningful reduction. While every supply chain is unique, common hotspot patterns emerge across packaging categories.
Raw Material Production Hotspots
For plastic packaging, resin production is typically the single largest emission source, accounting for 40 to 60 percent of cradle-to-gate carbon footprint. The emission intensity varies dramatically by material: virgin PET generates approximately 2.73 kg CO2e per kg, virgin HDPE approximately 1.93 kg CO2e per kg, and virgin PP approximately 1.86 kg CO2e per kg.
For metal packaging, primary aluminium production is extraordinarily carbon intensive at approximately 8.14 kg CO2e per kg, making aluminium packaging one of the highest-emission packaging materials on a per-kilogram basis. However, recycled aluminium reduces emissions by approximately 95 percent, making aluminium one of the most impactful materials for recycled content strategies.
Glass production generates approximately 0.85 kg CO2e per kg for virgin glass, with furnace energy being the dominant emission source. Glass weight means that absolute emissions per packaging unit can be significant despite moderate per-kilogram intensity.
Paper and cardboard production generates approximately 0.79 kg CO2e per kg, with significant variation based on fibre source (virgin vs. recycled), pulping process (mechanical vs. chemical), and energy source at the mill.
Manufacturing Process Hotspots
Packaging conversion processes (extrusion, blow moulding, thermoforming, printing, converting) typically contribute 15 to 25 percent of total emissions. Energy source is the critical variable: a blow moulding operation powered by renewable electricity can reduce manufacturing emissions by 70 to 90 percent compared to the same operation powered by grid electricity in a coal-heavy market.
Transportation Hotspots
Transportation emissions depend primarily on distance, mode, and load efficiency. Ocean freight generates approximately 0.008 kg CO2e per tonne-kilometre, making it the most carbon-efficient mode for long distances. Road freight generates approximately 0.062 kg CO2e per tonne-kilometre, roughly 8 times the intensity of ocean freight. Air freight generates approximately 0.602 kg CO2e per tonne-kilometre, roughly 75 times the intensity of ocean freight.
For lightweight packaging products, transportation can represent a disproportionately large share of emissions because the ratio of packaging weight to shipment volume is low, meaning more tonne-kilometres per unit of product.
Reduction Strategy Deep Dives
Material Selection as Carbon Strategy
The single most impactful carbon reduction strategy for most packaging companies is increasing recycled content. The emission reductions from using recycled materials are substantial and well-documented:
Recycled PET reduces per-kilogram emissions by approximately 60 percent compared to virgin PET. Recycled HDPE reduces emissions by approximately 50 percent. Recycled aluminium reduces emissions by approximately 95 percent. Recycled glass reduces emissions by approximately 30 percent. Recycled paperboard reduces emissions by approximately 25 to 40 percent.
For a company using 1,000 tonnes of virgin PET annually, switching to 50 percent rPET would reduce Scope 3 emissions by approximately 820 tonnes CO2e per year. At current carbon offset prices of USD 10 to 50 per tonne, this represents an equivalent value of USD 8,200 to USD 41,000 annually, in addition to potential EPR fee reductions.
Supplier Engagement Programs
Engaging suppliers to reduce their operational emissions addresses the upstream portion of Scope 3 that material switching alone cannot reach. Effective supplier engagement programs include carbon disclosure requirements in supplier contracts, preferencing suppliers with science-based targets, collaborative energy efficiency projects, and joint renewable energy procurement.
Leading packaging companies are finding that supplier engagement can reduce upstream Scope 3 emissions by 10 to 20 percent within 3 to 5 years, complementing material selection strategies.
Logistics Optimisation
Transportation emissions offer significant reduction potential through modal shift from road to rail or ocean, route optimisation using AI-powered logistics planning, improved vehicle utilisation through better load planning and packaging cube optimisation, and transition to low-carbon fuels including electric vehicles for last-mile delivery.
Packaging design plays an indirect but important role in logistics emissions. Lighter, more compact packaging reduces transportation emissions per unit of product delivered. Companies that optimise packaging for logistics efficiency alongside environmental performance achieve compounding benefits.
Reporting and Disclosure Requirements
CSRD Compliance for Scope 3
The EU's Corporate Sustainability Reporting Directive requires detailed Scope 3 disclosure including emission calculation methodology and data sources, description of value chain activities contributing to Scope 3, reduction targets and progress, and financial risks associated with Scope 3 emissions.
For packaging companies, Scope 3 disclosure must cover raw material production, transportation, and end-of-life emissions with sufficient granularity to demonstrate understanding and management of value chain impacts.
Integration with EPR and PPWR Reporting
Carbon reporting is increasingly integrated with EPR and PPWR compliance. The EU's Digital Product Passport requirements will include carbon footprint data at the packaging level, linking environmental performance reporting with regulatory compliance documentation. Companies that build integrated data systems now will avoid the cost and complexity of retrofitting separate reporting frameworks later.
Ready to automate your packaging compliance?
See how Packgine manages EPR, PPWR, and sustainability reporting from a single dashboard.